My SALSA Reports
The report generated can include data for a total of sixteen (16) standard variables which are collected in most clinical studies. In addition, study specific variables can be included in the analysis on a study specific basis (e.g. data related to the primary endpoint.
The variables are organised into five data sets:
- A vital sign data set
- A demographic data set
- An ECG data set
- An adverse event (AE) data set
- A concomitant medication data set
The vital sign data set is comprised of the variables height, weight, body temperature, respiratory rate, systolic and diastolic blood pressure and pulse rate. The demographic data set includes the variable gender and the ECG data set includes the duration of the QRS complex and the QT duration (raw data and corrected QT). The adverse event data set includes the variables number of AEs, seriousness and relationship. The concomitant medication data set includes the number of concomitant medication administered.
The report allows selection of data to be displayed first by investigational site and then by one of the five data sets described above. The variables contained in the selected data set are then displayed for the selected site. Data is always presented for one site at a time.
Each data set is presented in a data set summary table, variable-specific evaluations and a data appendix including AE and concomitant medication dataset: As these variables are not measured on a metrical scale no variable specific evaluations can be calculated. The data appendix functionality allows that any data point shown in one of the analysis results can be easily traced back to an individual subject or subjects.
As examples below, outlier data for duration of the QRS complex, distribution of body weights and proportion of blood pressure values in the hypotonic range are discussed.
Distribution of QRS
One outlier for QRS values (176ms with the next value 106ms) was identified in the data set. On the basis of this analysis, the patient was selected for source data (SD) evaluation during the audit and it was confirmed with the Study Coordinator (SC) that...
a) the value was indeed printed on the ECG and
b) that a comment had been added to the print-out by the investigator that the ECG was ‘normal’.
Subsequent checks confirmed that the eCRF system had auto-queried this value (according to the protocol, follow-up of elevated QRS results were required); however, the SC entering the data had answered the query ‘confirmed value, result is normal’. Furthermore, the CRA had source data verified the entry without taking any additional action, e.g. reporting as protocol deviation that no follow-up action had been taken. Processes for quality control of data and monitoring were subsequently reviewed and recommendations to strengthen the processes to avoid future undetected protocol deviations were made.

Distribution of Weight
Outliers in the distribution of body weights allow the auditor to focus on subjects for which this parameter can have a higher level of medical relevance.
In this example, one (adult) subject had an extremely low body weight (all data points between 36 kg and 37 kg originate from this subject). This is a typical trigger for subject selection for the audit sample. After confirmation of the accuracy of these data, the auditor assessed whether or not this low body weight was due to any co-morbidities and if this might be relevant for inclusion/exclusion criteria. After the subject was confirmed to be eligible for the study, Adverse Events were thoroughly evaluated to confirm that Adverse Events were not related to the low weight of the patient as baseline condition.

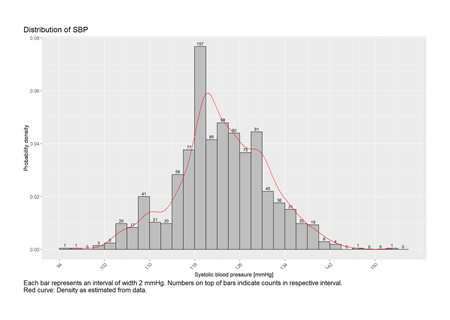
Distribution of SBP
The proportion of blood pressure values in the hypertonic range was significantly higher at one site than at other sites.
This can be used to review the patient population under study and identify a site specific bias in the study population. In addition, the information can be used by the auditor as the basis for evaluation of medical history to confirm that a high number of patients had hypertension at the start of the study and that this was entered in the medical records and eCRF, respectively at the respective site.

Contact us now to discuss your SALSA relevant questions